Optimal parameters for low noise
Applies to
Sensoft Multiline
Question
What are optimal software settings for rectangular enameled wires?
Answer
We recommend using the following settings:
1. Sensystem type K12
Your system is likely already configured this way, as we set it by default if we are aware of your application. You can check the Sensystem type in the Hardware configuration dialog (Figure 1). Only with type K12 you can set independent thresholds for the two sensor axes (LU x and LU y), measure the fault length and see the fault profile. Type K12 is the best setting whenever the wire velocity is under 60 m/min. Type K13 is equivalent to Type 12 in this contest.
2. Calibration files ending in _M
You can view the calibration files used in the Hardware configuration dialog (Figure 1). The ending letter of the calibration file indicates how the combined lump signal LU is calculated from the signals LU x and LU y of the two measured axes. If the calibration file ends in _W, it is calculated by LU = LU x + LU y, which is optimal for round wires. If it ends in _M, by LU = max(LU x, LU y), which is optimal for rectangular wires and always smaller than in the other case. In particular, also the noise of LU is smaller, basically half as large.
Note that LU x is the same in both cases, as is LU y. You will see a difference only if you use Lump (i.e. LU) or Neck-down (i.e. NE) in your criteria.
Figure 2 shows the effect with experimental data.
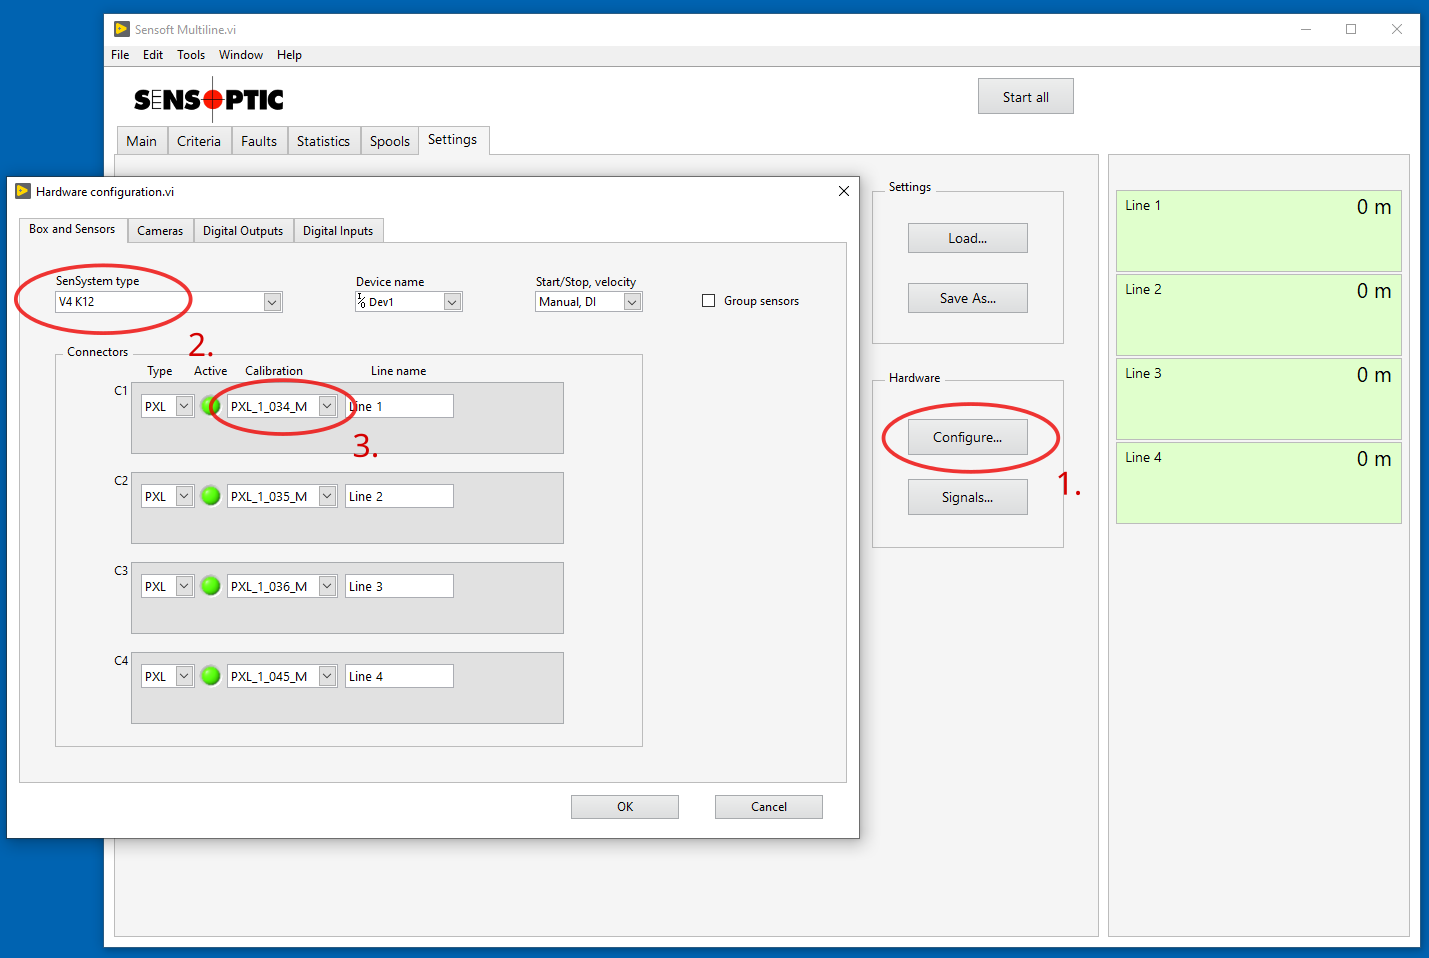 Figure 1: You open the Hardware configuration dialog by clicking on Configure... on page Settings (1.). There you see the Sensystem type (2.) and the calibration files (3.) |
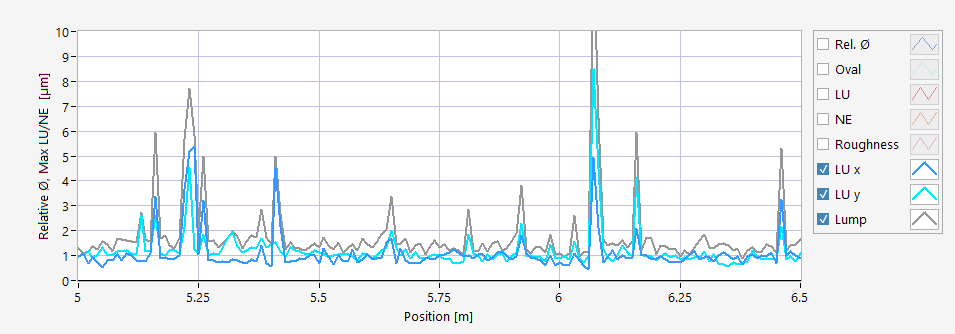 Figure 2: Noise due to dust particles with _W calibration file. Shown is the mean graph (the lower graph on page Statistics) in a measurement without wire. The measurement was performed with Mean data interval 1 cm and velocity 10 m/min, and the curves show the maximum value of the signal in the interval. The peaks are dust particles flowing in usual air, the baseline is the inherent noise of the sensor. Since the _W calibration was used, the combined LU signal (gray curve) is well above the single-axe signals (dark blue and light blue curves). With the _M calibration the gray curve would be at the same level of the blue curves. |
3. Filter.Lower cutoff frequency
This parameter can reduce the baseline value of the LU x, LU y, LU and NE signals.
These signals, measuring the defects, are defined as LU = DC - avg(DC), meaning the current shadow DC of the wire minus an average shadow of the wire, or simply put, wire with defect minus wire. The term avg(DC) is a moving average, by default over the last 20 seconds, which corresponds to the last 4 m of wire at a wire speed of 12 m/min. Suppose we have the criteria Alarm if 1 Lump > 50 µm. If the diameter during the last meters appeared say 10 µm smaller than now (either because it truly was or because the wire twisted slightly), a defect of 40 µm will set the alarm off. The fault profile will show an offset outside the defect, as shown in Figure 3, and also the mean graph, as shown in Figure 4.
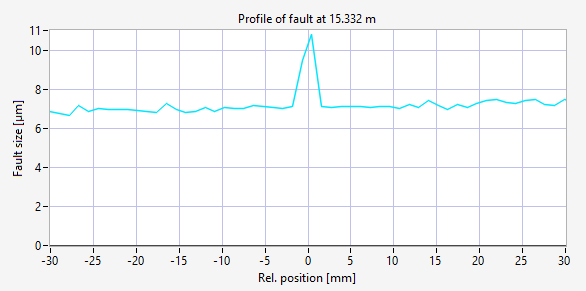 Figure 3: Fault profile of a defect when the average wire diameter does not correspond to the current wire diameter. Here a defect of 4 µm is recorded as 11 µm high since the current diameter is 7 µm off. The fault profile is shown in Sensoft Multiline on the Faults page if there is enough room (i.e. if the window is maximized). |
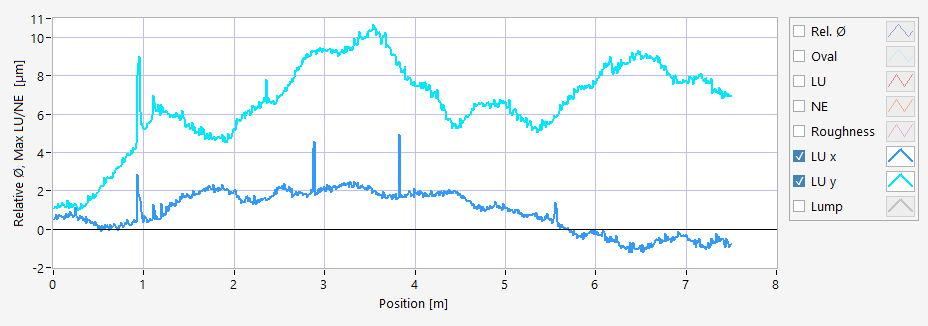 Figure 4: Mean graph when the average wire diameter does not correspond to the current wire diameter. In this measurement there is an offset that in certain cases is larger than the defects. Note that in this measurement the resolution of the mean graph is set very high (1 cm). With a typical Mean data interval of 1 m, the offset would not be visible. |
Consider changing Filter.Lower cutoff frequency from 0.05 Hz to 2 Hz. This corresponds to lowering the averaging length to about 10 cm. This prevents measuring an eventual wobble or eventual meter-long diameter variations. It also avoids the offset seen in Figures 3 and 4. All these three things are normally desired. See here how to change this parameter.
The exact averaging length is L = v / flc where flc is the Filter.Lower cutoff frequency and v is the minimal wire velocity at which your lines might be running. We consider L > 8 cm aggressive and would not go below 5 cm. Avg(DC) uses the median for averaging, which remains correct even if up to half of L is covered by a large defect.
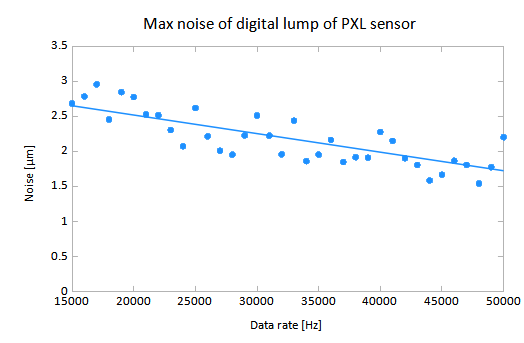
Figure 5: Sensor noise versus Data rate. The noise decreases only slightly for higher data rates. This measurement includes all noise sources that you cannot control. The measurement was done without wire, reducing air convection (so there are no dust peaks as in Figure 2), with a PXL sensor and the velocity set at 10 m/min. The displayed noise is the 99th percentile, meaning that in 99% of the time the noise is less than that.
4. Data rate
We recommend a Data rate of about 20 000 Hz, it is set on page Settings. With a wire velocity around 10 m/min the noise does not decrease much with higher data rate (Figure 5), but computer resource usage tends to increase.
Figure 5 shows the noise you can expect from a PXL sensor at a wire velocity of 10 m/min under perfect conditions (i.e. no dust in the air, no wire vibration, ...). The displayed noise is the 99th percentile, meaning that in 99% of the time the noise is less than that. The mean noise, i.e. the most probable to have, is about 1 µm less.
5. Fault clustering
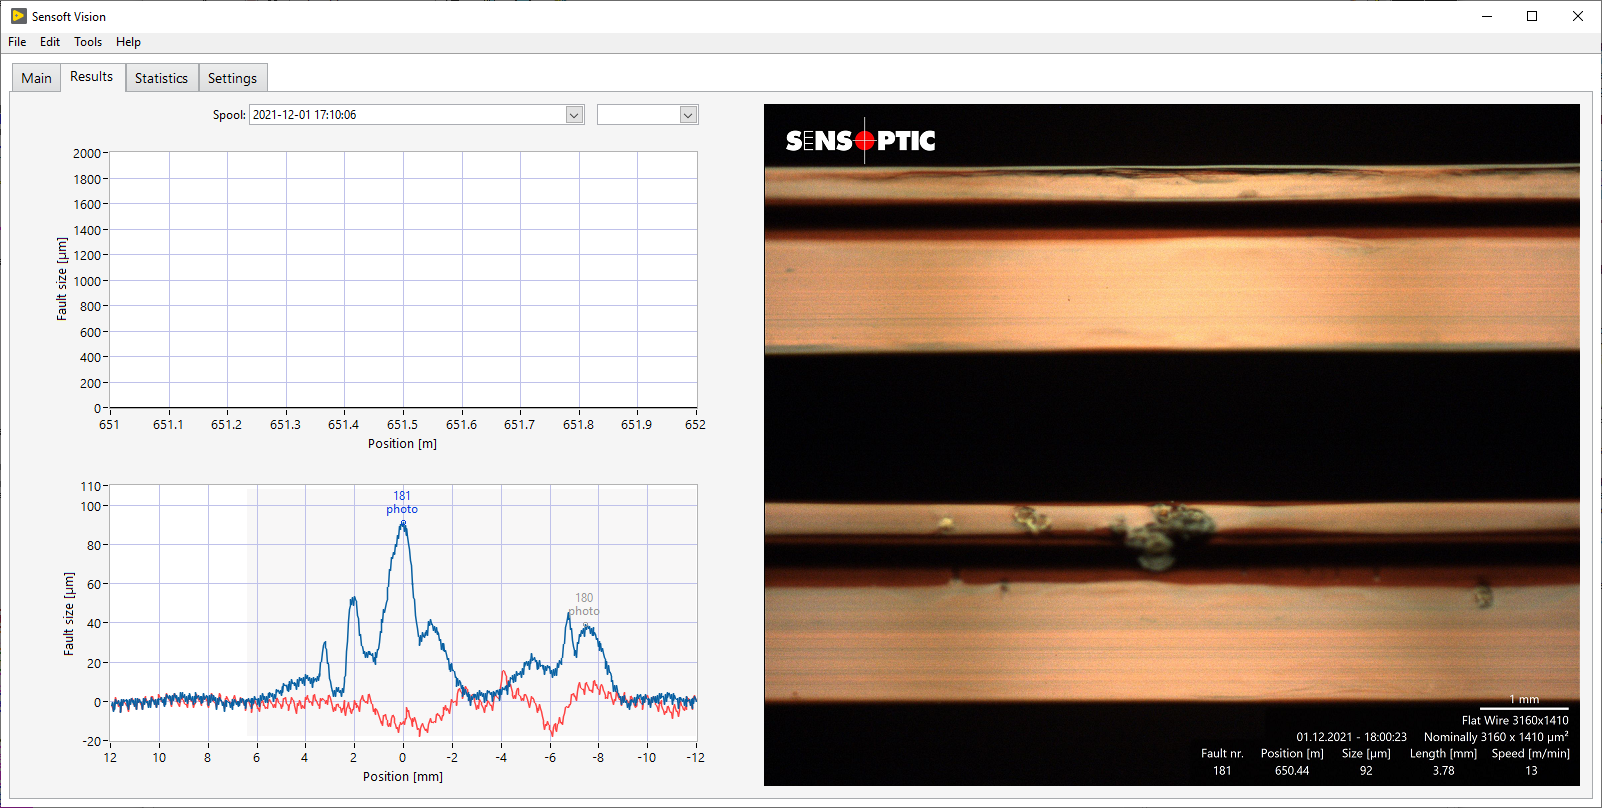
Figure 6: Screenshot of a blister cluster in Sensoft Vision. The graph on the left shows the profile of the defect along the two measuring axes. Without clustering, at a threshold of 40 um it would count as 4 faults.
In enameled wire production beads often come in clusters, like in Figure 6. By default, every peak that crosses the threshold is counted as a fault. This leads to a single cluster being calculated as multiple faults. Especially if they are all covered by the same marking, it may be worth to count them as just one fault. This is done by fault clustering. Please refer to the dedicated article on fault clustering for the pro and cons, and how to enable it.
6. Faults at the corners
Some end clients specify inspection also at the rounded corners of the rectangular wire. For this we need to measure the wire at additional axes. Please refer to this dedicated page.
Non-software optimizations
Even the best software parameters cannot eliminate real disturbances like dust or wire vibrations that genuinely block sensor light. Therefore we include some tips on how to reduce these.
7. Electrical isolation of the sensor
The sensor should not be in electrical contact with its holder. The sensor is grounded via its cable to the Sensystem box and an additional ground via the holder can cause a ground loop that increases the noise.
8. Tilt and torsion
For rectangular wire it is very important that the faces are well aligned with the axes of the sensor, i.e. that there is no tilt. If there is a tilt, you will miss defects because they are shadowed by one of the edges of the wire. It is also important that there is no torsion, i.e. varying, oscillating tilt. Large torsion leads to specific fake defects, and small torsion still increases the noise. For info and graphs of torsion faults please see pages 4 to 7 of this document. The document is written for our product Sensoft Vision, but effect of the torsion is the same.
9. Dust from air
Causes peaks of some micrometers to some tens of micrometers in height. This can be minimized by covering the whole sensor with a box, or even better setting it in a box and use clean compressed air to create a slight over-pressure. The same can be tried covering just the sensor hole.
10. Dust on wire, dust falling off from wire
Often you don't want to record a dust particle on the wire as a defect. Or dust can fall off the wire, especially at wire guides, and give a false signal. To minimize this, a wire blower can be mounted in front of the sensor. There are commercial models available, but a custom blower can also be built using simple materials and tools for a cost-effective solution.
11. Wire vibrations
Usually not a big problem, since guides can hold the wire in position. Large twists of the wire are problematic and result in periodic noise. It can also happen that a dirt particle lies on the optical window of the sensor exactly at the border of the shadow made by the wire. That causes noise if the wire changes position.