
Opening TDMS files
Applies to
Sensoft Multiline
Sensoft Vision
Question
How can I open .tdms files? Can I also parse them programmatically?
Answer
TDMS files are similar to spreadsheets. They can be opened in Excel by double-click and parsed with many programming languages (we recommend doing it in Python).
Excel
When Sensoft is installed, an add-in for Excel is installed, which allows to open TDMS files in Excel by double-clicking them in the File Explorer. You can also open them directly from Sensoft Multiline (button Open in Excel on page Faults) and Sensoft Vision (on page Results click with the right mouse button on the Spool field or the faults graph and select Open in Excel from the context menu).
Manual installation
If you haven't installed Sensoft, you can also manually install the add-in. The add-in can is made by NI and there are two versions:
- ni-tdm-excel-addin_21.3.0_offline.zip (you can also download it directly from NI, after a free registration, at this link)
- ni-tdm-excel-addin_26.3.0_offline.zip (NI link)
The version installed with Sensoft is version 21.3. It works with any desktop version of Excel (Excel 2003 to Excel 2024, Excel 365 desktop) but not with Excel 365 web. Since 2025, for security reasons Excel add-ins have to be activated in order to work. The Sensoft installer tries to do this automatically, but it has been tested only with Excel 2019. Version 26.3 has not been tested yet, but is expected to alleviate the add-in activation.
Troubleshoot
If you installed Sensoft or the add-in, and you cannot open the .tdms files from File Explorer:
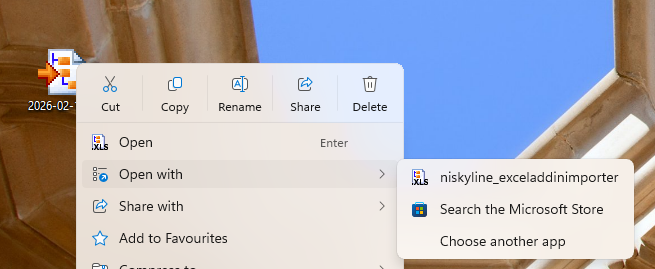
Figure 1: Icon of .tdms files when connected correctly to the add-in. Here the right mouse button was pressed and Open with was selected to show the add-in app.
Look if .tdms files are opened by default with the add-in. The icon of .tdms files should look like as in Figure 1. You can select the app that opens .tdms files by clicking with the right mouse button on the .tdms file and select Open with, as in Figure 1. To select the default app, select Choose another app.
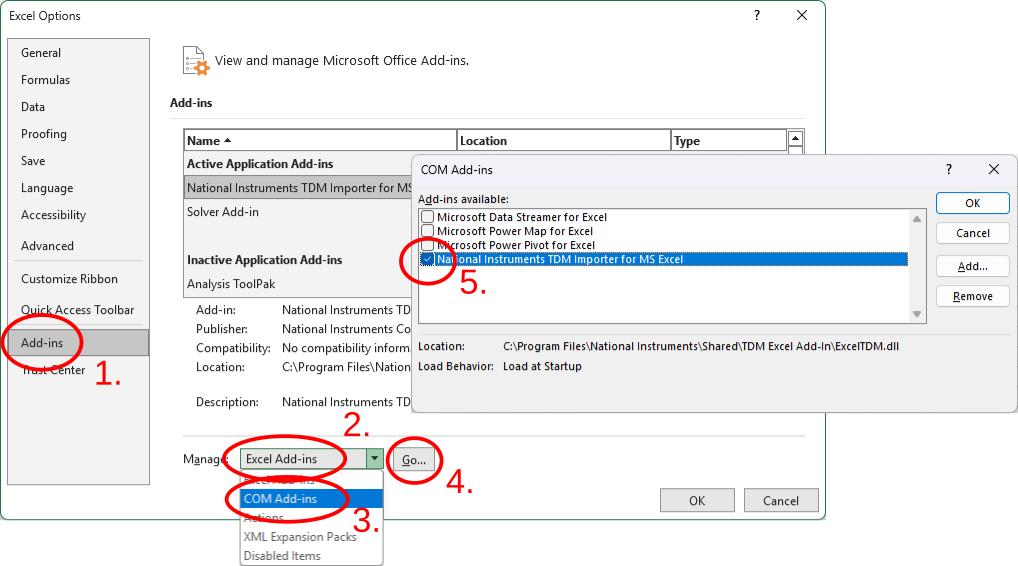
Figure 2: 1. Click Add-ins in the left pane. 2. Press on the Manage: combobox and 3. Choose Com Add-ins, 4. Press Go... and 5. Activate the TDM add-in.
Manual activation. It may be that you have to activate the add-in manually. For this open the Excel Options by pressing File and then Options. Then follow Figure 2: Click Add-ins in the left pane, in Manage choose Com Add-ins, press Go... and activate the TDM add-in.
Labview
Labview has excellent TDMS support (read, write and show the data in a graphical user interface).
Python
Use the npTDMS library to read TDMS files. The following script prints the fault positions and sizes:
from nptdms import TdmsFile
import os

os.chdir(r"C:\Users\xxx\Documents\LabVIEW Data\Sensoft\Data\Vision\")
FilenameTdms = "2026-02-19T17_18_19.tdms"

with TdmsFile.open(FilenameTdms) as Tdms:
    Faults = Tdms['Faults']
    Positions = Faults['Position [m]']
    Sizes = Faults['Size [um]']

    print("Position [m]:", Positions[:])
    print("Size [um]:", Sizes[:])
To install the nptdms package, after having installed Python (letting it add to PATH), open a Command prompt and type:
pip install npTDMS
Other languages
- MATLAB: Native support is available through the built-in tdmsread function. Alternatively, the community-created TDMS Reader on MATLAB Central handles files without needing any external DLLs.
- C# / .NET: The managed open-source library TDMSReader can parse TDMS structures natively across Windows and Mono.
- C / C++: National Instruments provides a free, officially supported TDM C DLL download to read and write these files in any standard C-compatible development environment. Community alternatives like libtdms or TDMSpp provide native cross-platform implementations.
- Rust: The tdms-rs crate delivers safe, native parser APIs to stream and process TDMS binary structures.
- Julia: The TDMSReader.jl package implements the format natively for data science workflows.
- R: The readTDMS package lets data analysts parse streams, map timestamps, and pull amplitude arrays directly into data frames.
Specifications
Spool file
The spool file contains the data of one measurement, which often corresponds to a spool.
Sensoft Vision
The spool file is located at <Data folder>\<Spool identifier>\<Timestamp>.tdms where Data folder is a field on page Settings, Spool identifier a field on page Main and Timestamp is the start time in the format <Year>-<Month>-<Day>T<Hour>_<Minute>_<Second>, where Year has 4 digits and the others 2 digits.
In Sensoft Vision 2.0 and later the contents of the spool file are:
- Sheet <Filename> (root): Ignore this sheet, it's just created by the Excel TDMS importer to store metadata and properties. The following list gives the properties set by Sensoft. Excel converts their names to IEC 61131-3, i.e. just alphanumeric plus underscore.
- Axes: Number of axes of the sensor.
- Creator: The software that created the file, i.e. "Sensoft Vision".
- End position [m]: Wire position at the end of the measurement.
- End time: Time at the end of the measurement.
- Filament type: Field Filament type on page Settings (Enameled wire, Monofilament, Multifilament). Rectangular wires normally use Monofilament.
- File version: Version of the spool file specs.
- LU threshold [um]: Threshold for lumps. If Advanced criteria are used, the minimum lump threshold.
- LU y threshold [um]: Only available if the Threshold for lumps. If Advanced criteria are used, the minimum lump threshold.
- NE threshold [um]: Threshold for neck-downs, if provided, else NaN (which in Excel is displayed as 65535).
- NE y threshold [um]: Threshold for neck-downs, if provided, else NaN (which in Excel is displayed as 65535).
- Nominal diam [um]: If provided on page Main, the nominal diameter of the wire, else 0. If the nominal diameter is provided for both axes, the average of them.
- Nominal ovality [um]: (nom. Øx - nom. Øy)/2
- Pic heigth [px]: Height of the picture without the black border of 3 px per side.
- Pic orientation: How the wire is located on the photo (Diagonal or Horizontal). Diagonal with one camera, Horizontal with two.
- Pic scale [px/mm]: Absolute scale of the picture. Zero if Optical magnification on page Main is not provided.
- Pic width [px]: Width of the picture without the black border of 3 px per side.
- Sensor: Type and version number of the sensor.
- Signal: Signal/Expected signal, minimum over all axes, at the end of the measurement. Tells how dirty the optical windows of the sensor are. "NaN %" if Nominal diameter on page Main is not provided.
- Spool identifier: Content of field Spool identifier on page Main.
- Start time: Time at the start of the measurement.
- Sheet Faults: List of all faults and their properties. Contrarily to Sensoft Multiline, overlapping faults are stored on a single row.
- Time: When the fault occurred. Time of maximal fault size.
- Fault nr.: A sequential number, starting at 1.
- Position [m]: Position of the fault, i.e. how many metres have passed since measurement start. Position of maximal fault size.
- Size [um]: Fault size, signed. Extremum value over the fault. If Type is LU x (or LU y), the extremum value of LU x (resp. LU y).
- Velocity [m/min]: Wire speed.
- Length [mm]: Fault length, measured at the threshold. If the fault satisfies multiple criteria with different thresholds, the longest fault length.
- Artificial: Info on whether a user or an AI model marked the fault as fake and whether they have the authority to exclude the fault. For details please see the last chapter of the previous link.
- Has photo: 1 if the fault has a photo, 0 otherwise
- Has graph: 1 if the fault has a profile graph, 0 otherwise
- Lump [um]: Value of LU at Position [m].
- Neckdown [um]: Value of NE at Position [m].
- dDiam. x [um]: Extremum values of AC x over the fault. Used for the top left graph on page Statistics.
- dDiam. y [um]: Extremum values of AC y over the fault. Used for the top left graph on page Statistics.
- dDiam. z [um]: Only available for 3-axial sensors (PXT). Extremum values of AC z over the fault. Used for the top left graph on page Statistics.
- Axis: Only available for 3-axial sensors (PXT). Axis with the maximal Fault size/Threshold ratio. 1-based: 1 = x-axis, 2 = y-axis, 3 = z-axis.
- Type: Fault type (Lump, Neck-down, LU x, LU y, NE x, or NE y). If the fault satisfies multiple criteria, a comma separated list of all different types.
- Severity: Only set with advanced criteria. The alert type (Alarm, Warning, Alarm and Warning).
- In criteria: Only set with advanced criteria. Comma separated list of which criteria the fault satisfies. E.g. if your criteria are:
Alarm if 10 lumps > 50 µm
Warning if 10 lumps > 40 µm
a lump of size 60 µm would have 1, 2 in that column, because it satisfies the condition (lump > xx µm) of both the first and the second criterion. - Comments: Comment added by the user to a fault (by clicking with the right mouse button on the photo and selecting Add Comment from the context menu).
- Overlapping faults are store on separate rows.
- Sheet Fault contours: The profile graphs on page Results. The sheet contains the fault size data (y-axis of the graph), the points are equidistant on the x-axis of the graph. The point spacing and start position are on the x-axis are stored in the first sheet, see the values wf_increment and wf_start_time.
- Sheet Mean: Data of the bottom right graph on page Statistics. This data is recorded periodically, i.e. also if the signal stays below threshold. The data interval is set by Mean data interval [m] on page Settings.
- Position [m]: Position of the data point.
- DC x avg. [um]: Average of DC x signal over Mean data interval [m]. The DC signal is the mean diameter over Sensor.Baseline range [m], a field in the advanced settings on page Settings.
- DC y avg. [um]: Average of DC y signal over Mean data interval [m].
- DC z avg. [um]: Only available for 3-axial sensors (PXT). Average of DC z signal over Mean data interval [m].
- LU max. [um]: Maximum value of LU over Mean data interval [m].
- NE max. [um]: Maximum value of |NE| over Mean data interval [m].
- Sheet Histo: The most important configuration parameters.
- Sheet Alerts: Only available with advanced criteria. List of all alerts that occurred, i.e. the warnings and alarms.
- Time: When the alert occurred. Fault time of the last fault needed to fully satisfy the criterion.
- Position [m]: Alert position.
- Severity: Alarm or Warning.
- Criterion: Which of the criteria was satisfied. 1 means first criterion (first row in the field Criteria on page Main).
Sensoft Multiline
The location of the spool file is user configurable, but defaults to: <Data folder>\<Year>\<Month>\<Day>\<Timestamp> - <Spool ID> - <Linename>.tdms where Data folder is a field on page Settings, Spool ID a field on page Criteria, Linename the line name (displayed in the right panel and settable in the hardware settings) and Timestamp is the start time in the format <Year>-<Month>-<Day> <Hour>h<Minute>m<Second>, where Year has 4 digits and the others 2 digits. Note that also in the folder name Year, Month and Day refer to the start time, even it the measurement lasted more than one day.
In Sensoft Multiline 1.3 and later the contents of the spool file are (earlier versions lack some minor data):
- Sheet <Filename>: Ignore this sheet, it's just created by the Excel TDMS importer to store metadata and properties. The following list gives the properties set by Sensoft. Excel converts their names to IEC 61131-3, i.e. just alphanumeric plus underscore.
- Axes: Number of axes of the sensor.
- Creator: The software that created the file, i.e. "Sensoft Multiline" or "Sensoft Multiline with Cam"
- File version: Version of the spool file specs.
- Photo path: Only available if you have a camera module. Path of the folder where the photos of the faults are stored, relative to the path of the spool file.
- Pic heigth [px]: Only available if you have a camera module. Height of the picture without the black border of 3 px per side.
- Pic orientation: Only available if you have a camera module. How the wire is located on the photo (Diagonal or Horizontal). Always Horizontal because the camera module always has two cameras.
- Pic scale [px/mm]: Only available if you have a camera module. Absolute scale of the picture.
- Pic width [px]: Only available if you have a camera module. Width of the picture without the black border of 3 px per side.
- Sheet Faults: List of all faults and their properties. Contrarily to Sensoft Vision, overlapping faults are stored on separate rows.
- Time: When the fault occurred. Time of maximal fault size.
- Fault nr.: A sequential number, starting at 1.
- Position [m]: Position of the fault, i.e. how many metres have passed since measurement start. Position of maximal fault size.
- Size [um]: Fault size, signed. Extremum value over the fault. If Type is LU x (or LU y), the extremum value of LU x (resp. LU y).
- Velocity [m/min]: Wire speed at the time of the fault.
- Length [mm]: Fault length, measured at the threshold. If the fault satisfies multiple criteria with different thresholds, the longest fault length.
- Artificial: Info on whether a user or an AI model marked the fault as fake and whether they have the authority to exclude the fault. For details please see the last chapter of the previous link.
- Type: Fault type. Can be a built-in (Lump, Neck-down, Roughness, Diameter, Ovality, Wire break, Warning, Alarm, Signal, LU x, NE x, LU y, NE y, LU xy, NE xy, Position, Velocity, Rel. diameter, Rel. ovality, LU corner, NE corner) or a custom sensor name.
- Severity: The alert type (Alarm, Warning).
- Criterion: Criterion the fault refers to. 1-based, i.e. 1 means first criterion. If the fault satisfies more than one criterion, it has multiple rows in the Faults list.
- Has photo: Only available if you have a camera module. 1 if the fault has a photo, 0 otherwise.
- Sheet Mean: Data of the bottom graph on page Statistics. This data is recorded periodically, i.e. also if the signal stays below threshold. The data interval is set by Mean data interval [m] on page Settings.
- Time: Time of the data point.
- Position [m]: Position of the data point.
- Avg. rel. diam. x [um]: Average of DC x signal over Mean data interval [m]. The DC signal is the mean diameter over 1/Filter.Lower cutoff frequency [Hz], a field available on the Debug page when pressing Ctrl - D. Each axis has its own column. For 2-axial sensors the indices are x, y; for 3-axial x, y, z; for 4-axial: 1, 2, 3, 4; and so forth.
- Roughness x [um]: Standard deviation of AC x signal over Mean data interval [m]. Each axis has its own column. For 2-axial sensors the indices are x, y; for 3-axial x, y, z; for 4-axial: 1, 2, 3, 4; and so forth.
- LU max. [um]: For high-velocity Sensystems (wire speed > 60 m/min): Maximum value of LU over Mean data interval [m]. Else NaN (which Excel shows as 65535).
- NE max. [um]: For high-velocity Sensystems (wire speed > 60 m/min): Maximum value of |NE| over Mean data interval [m]. Else NaN (which Excel shows as 65535).
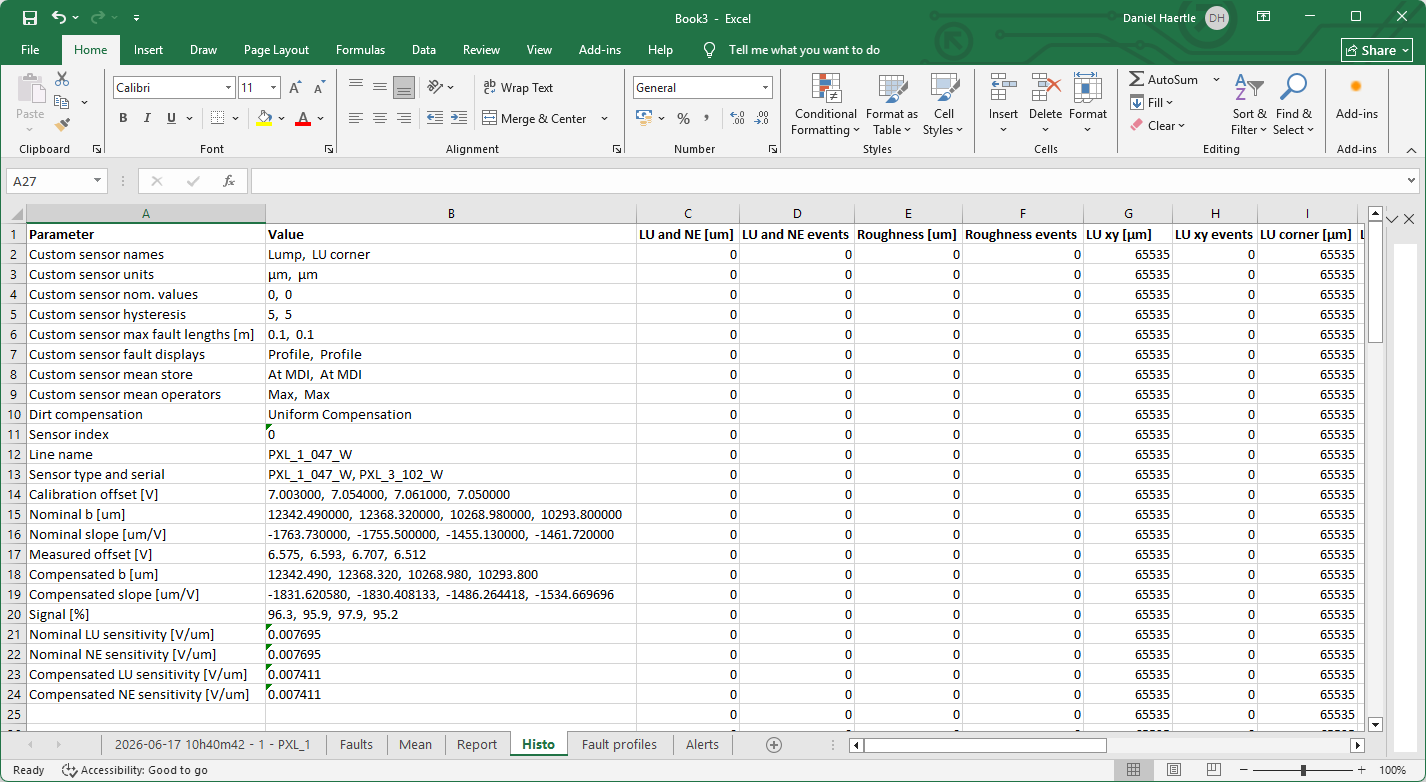
Figure 3: Sheet Histo of a Sensoft Multiline spool file.
Lump [µm], LU xy [µm], LU corner [µm], any element of Type [unit] or any Custom sensor name [unit]: All these are treated like custom sensors. There is a column for each custom sensor. The column is named CSName [CSUnit] where CSName is an element of Histo.Custom sensor names and CSUnit is an element of Histo.Custom sensor units. The data is CSOperator over Mean data interval [m] of the custom sensor signal. CSOperator is an element of Histo.Custom sensor mean operators. Example: If your criteria contain Lump and LU corner, you get custom sensor data on sheet Histo as in Figure 3, and thus in sheet Mean two columns named Lump [µm] and LU corner [µm] with data values Max(Lump) and Max(LU corner).
- Sheet Report: A summary of the spool's properties and results.
- Criterion and Alerts: Lists all criteria (i.e. rows of field Criteria on page Criteria) and the number of alerts the criterion generated.
- Spool ID, Order, Product, Description, Grade: Tags of the spool, settable on page Criteria or by OPC UA.
- Line name: Line name as set in the hardware settings an displayed in the right pane.
- Length [m]: Wire position at the end of the measurement.
- Nom. diam. [um]: Nominal diameter of the wire, or in case the nominal diameter is specified for all axes, the nominal width along the x-axis.
- Nom. diam. y [um]: Only available if the nominal diameter is specified for all axes. The nominal width along the y-axis.
- Spool OK: OK if the spool has no alarm, Not OK if it has.
- Start time, End time: Time at the start and end of the measurement.
- Speed [m/min]: Average speed over the entire spool.
- Avg. diam. [um], Ovality [um], Roughness [um]: Average values over the entire spool (arithmetic mean of the corresponding columns in sheet Mean).
- Alerts text, BG color: Data for displaying the field Alerts on page Faults.
- Sheet Histo: First two columns contain the most important configuration parameters. The other columns are data for the histogram on page Statistics.
- Sheet Fault profiles: The data for the profile graph on page Results and Photos. There are three column for each custom sensor that has faults. The columns are named CSName: Position [m], CSName [CSUnit], and CSName: Info. Here CSName is an element of Histo.Custom sensor names and CSUnit is an element of Histo.Custom sensor units. The first two of these columns contain the positions (x-values) and the sizes (y-values) of the profile graphs of all faults of type CSName, separated by a row with value NaN. The third column, CSName: Info, provides a quick way to find the row numbers. For each fault of type CSName it has 5 data rows of information: Starting row, number of points, and three placeholder values (-1) for future information. As an example, with Figure 3, if we have 2 faults of type Lump, we have the columns: Lump: Position [m], Lump [µm], and Lump: Info. In column Lump: Info we have 10 data rows.
- Sheet Alerts: List of all alerts that occurred, i.e. the warnings and alarms.
- Time: When the alert occurred. Fault time of the last fault needed to fully satisfy the criterion.
- Position [m]: Alert position.
- Severity: Alarm or Warning.
- Criterion: Which of the criteria was satisfied. 1 means first criterion (first row in the field Criteria on page Criteria).
Report file
A daily list of the spools that finished that day.
Content and filename of the report file is equal for Sensoft Vision and Sensoft Multiline. Its folder is:
- For Sensoft Vision:
<Data folder>\Report\<Year>\<Month>\<Day>where Data folder is a field on page Settings, Year has 4 digits and the others 2 digits. - For Sensoft Multiline: By default in the same folder as the spools:
<Data folder>\<Year>\<Month>\<Day>where Data folder is a field on page Settings, Year has 4 digits and the others 2 digits. If the spool folder is user configured, the report folder is equal to the spool folder if all the spools of the day are saved in the same folder., then the report is saved with them, otherwise the report is saved in<Data Folder>\Reports\<YYYY>\<MM>\. In order that all spools are saved in the same folder, the Folder mode string can contain only the variable Start time in its sub-folder part.
The filename of the report file is <Year>-<Month>-<Day> Report - <Linenames>.tdms where Year has 4 digits, Month and day 2 digits, and Linenames is <Linename> if there is just one line, and <First Linename> to <Last Linename> if there are more. Linename is the line name (displayed in the right panel and settable in the hardware settings) and First means the top one and Last the bottom one.
The contents of the report file are:
- Sheet <Filename>: Ignore this sheet, it's just created by the Excel TDMS importer to store metadata and properties. The following list gives the properties set by Sensoft. Excel converts their names to IEC 61131-3, i.e. just alphanumeric plus underscore.
- Creator: The software that created the file, i.e. "Sensoft Vision", "Sensoft Multiline" or "Sensoft Multiline with Cam"
- File version: Version of the report file specs.
- Report suffix: The
- <Linenames>part of the filename. - Start time: When the report file was first created.
- Sheet Report: List of the spools that finished on this day
- Spool ID, Order, Product, Description, Grade: Tags of the spool, settable on page Criteria or by OPC UA.
- Line name: Line name as set in the hardware settings an displayed in the right pane.
- Length [m]: Wire position at the end of the measurement.
- Spool OK: OK if the spool has no alarm, Not OK if it has.
- Start time, End time: Time at the start and end of the measurement.
- Nom. diam. [um], Nom. diam. y [um]: Nominal width along the x-axis and the y-axis.
- Speed [m/min]: Average speed over the entire spool.
- Avg. diam. [um], Ovality [um], Roughness [um]: Average values over the entire spool (arithmetic mean of the corresponding columns in sheet Mean).
- Data file path: Path, relative to the report file, of the spool file.
- Creator: The software that created the spool file, i.e. "Sensoft Vision", "Sensoft Multiline" or "Sensoft Multiline with Cam"
- Alarms, Warnings: Number of alarms (resp. warnings) that occurred in the spool.
- Alarm faults, Warning faults, LU alarm faults, LU warning faults, NE alarm faults, NE warning faults, Roughness alarm faults, Roughness warning faults, Diameter alarm faults, Diameter warning faults: Number of faults in these categories.
AI cache
A file for caching inferred AI results. For the specs see Chapter Cache on the AI page.